
matplotlib: How to easily format y value as percent [%]
When plotting our time series example dataset, this is the resulting plot
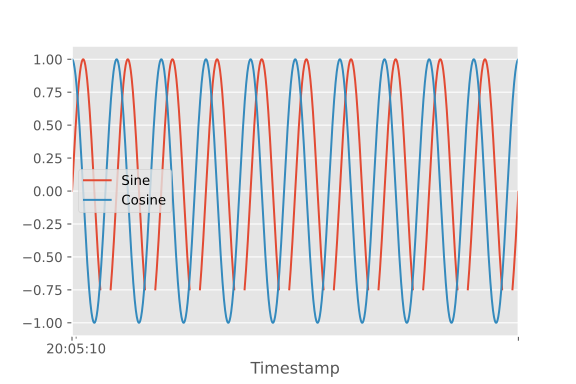
This post shows how to easily plot this dataset with an y axis formatted as percent. We will assume that 1.00 maps to 100%. This post is based on our previous work on Matplotlib custom SI-prefix unit tick formatter:
Note that for pandas, you need to first call df.plot() and call set_major_formatter() after that!
matplotlib_percent.py
import matplotlib.ticker as mtick
df.plot()
plt.gca().yaxis.set_major_formatter(mtick.PercentFormatter(xmax=1.0))If you instead want 100.0 to map to 100%, just use xmax=100.0:
matplotlib_percent_example.py
import matplotlib.ticker as mtick
df.plot()
plt.gca().yaxis.set_major_formatter(mtick.PercentFormatter(xmax=1.0))Full example
matplotlib_full_example.py
import matplotlib.ticker as mtick

# Load pre-built time series example dataset
df = pd.read_csv("https://datasets.techoverflow.net/timeseries-example.csv", parse_dates=["Timestamp"])
df.set_index("Timestamp", inplace=True)

# Plot with Y axis scaled as percent
df.plot()
plt.gca().yaxis.set_major_formatter(mtick.PercentFormatter(xmax=1.0))If this post helped you, please consider buying me a coffee or donating via PayPal to support research & publishing of new posts on TechOverflow