
通过 Graphviz 进行图布局
问题:
你想显示一个图。
解决方案:
创建一个描述你的图的简单文本文件,并以 .dot 文件扩展名保存:
example.dot
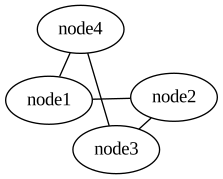
graph {
node1 -- node2;
node2 -- node3;
node3 -- node4;
node4 -- node1;
}之后你可以使用 graphviz 包的程序(sudo apt-get install graphviz)来可视化图。此包包含不同的布局程序如 dot、neato、fdp(都来自 GraphViz 项目)等。只需调用其中一个程序来可视化图:
neato_command.sh
neato -Tsvg yourFile.dot -o outputFile.svg此命令的输出:
Check out similar posts by category:
Allgemein
If this post helped you, please consider buying me a coffee or donating via PayPal to support research & publishing of new posts on TechOverflow