
使用 UliEngineering 在 Python 中轻松生成方波/三角波/锯齿波/反锯齿波数据
在之前的文章中,我详细介绍了如何仅用一行代码生成具有频率、振幅、偏移、相移和时间偏移的正弦/余弦波数据。
本文扩展了此方法,展示如何生成方波、三角波、锯齿波和反锯齿波数据 - 仍然只需一行代码。
所有参数,包括频率、振幅、偏移、相移和时间偏移也适用于这些函数 - 请参见之前的文章了解这些参数的详情和示例。
我们使用 UliEngineering 库,更具体地说是 UliEngineering.SignalProcessing.Simulation 包:
首先,安装 UliEngineering。
方波
square_wave_example.py
from UliEngineering.SignalProcessing.Simulation import square_wave

data = square_wave(frequency=10.0, samplerate=10e3)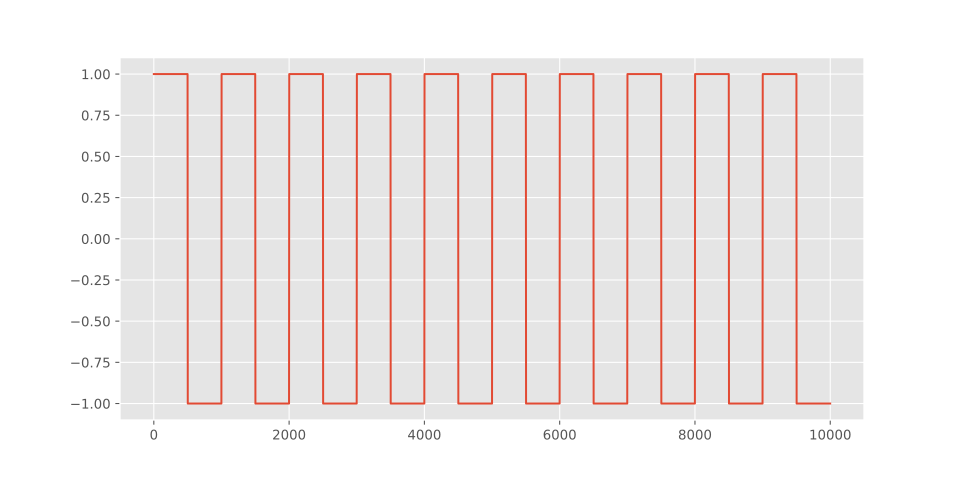
三角波
triangle_wave_example.py
from UliEngineering.SignalProcessing.Simulation import triangle_wave

data = triangle_wave(frequency=10.0, samplerate=10e3)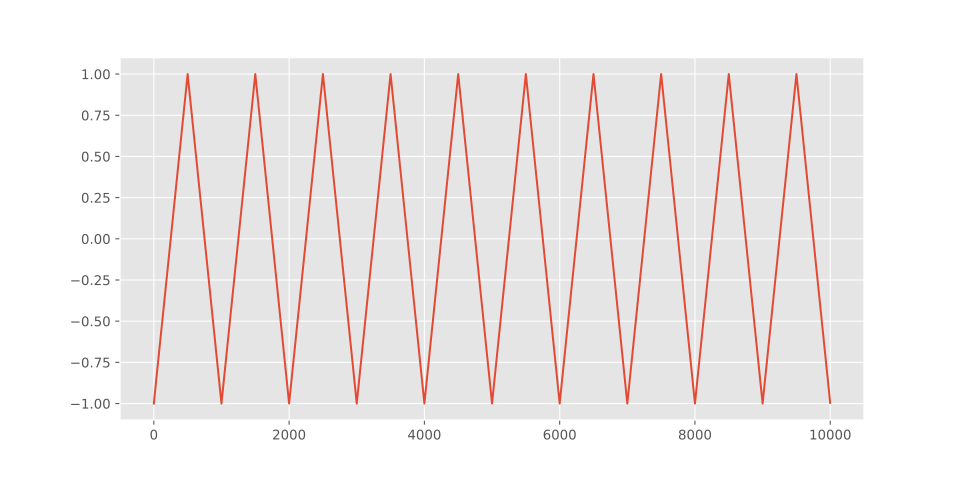
锯齿波
sawtooth_example.py
from UliEngineering.SignalProcessing.Simulation import sawtooth

data = sawtooth(frequency=10.0, samplerate=10e3)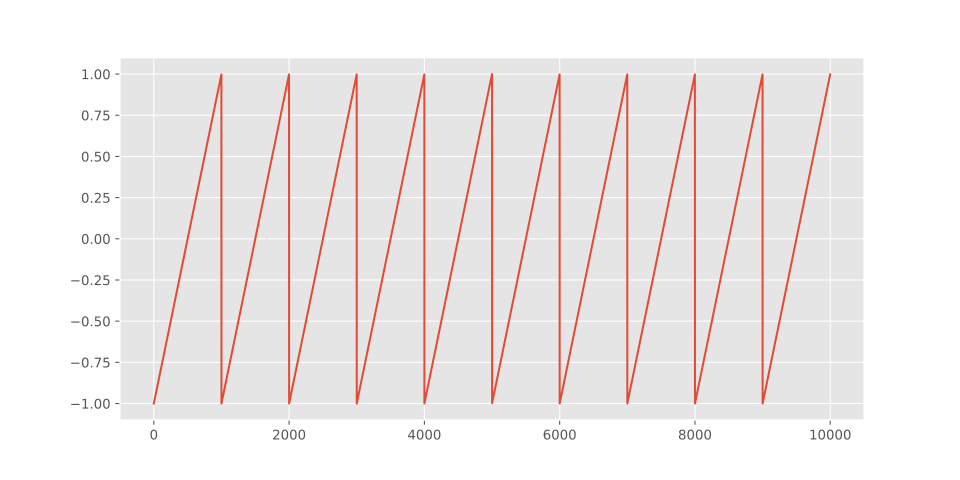
反锯齿波
inverse_sawtooth_example.py
from UliEngineering.SignalProcessing.Simulation import inverse_sawtooth

data = inverse_sawtooth(frequency=10.0, samplerate=10e3)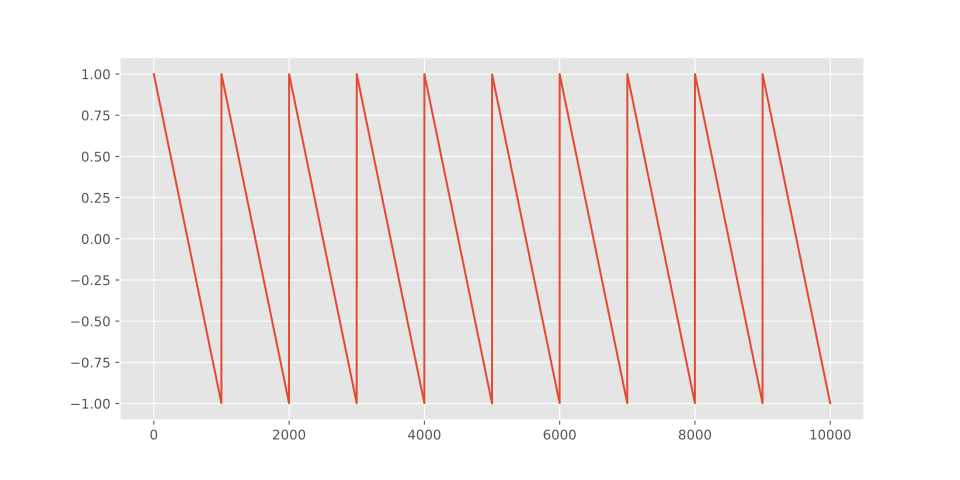
绘图代码
此代码用于在 Jupyter 中生成本文的图:
plot_waveforms.py
%matplotlib inline
from matplotlib import pyplot as plt
plt.style.use("ggplot")

from UliEngineering.SignalProcessing.Simulation import square_wave

data = square_wave(frequency=10.0, samplerate=10e3)

# set_size_inches(20, 10) 使其更大!
plt.gcf().set_size_inches(10, 5)
plt.plot(data, label="original")
plt.savefig("/dev/shm/square-wave.svg")Check out similar posts by category:
Data Science, Mathematics, Python
If this post helped you, please consider buying me a coffee or donating via PayPal to support research & publishing of new posts on TechOverflow