
如何使 lifelines Kaplan-Meier 图的 Y 轴从 0 开始
使用 lifelines 库,你可以轻松绘制 Kaplan-Meier 图,例如在我们之前的文章最小 Python Kaplan-Meier 图示例中所见:
kaplan_meier_example.py
from lifelines.datasets import load_leukemia
from lifelines import KaplanMeierFitter
df = load_leukemia()

kmf = KaplanMeierFitter()
kmf.fit(df['t'], df['Rx']) # t = 时间点, Rx: 0=删失, 1=事件
kmf.plot()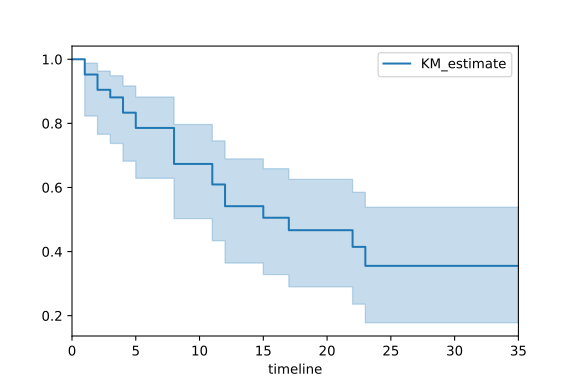
如果你想使 Y 轴从 0.0 开始而不是像此示例中约 0.2 开始怎么办?
记住 lifelines 只是在内部调用 matplotlib,km.plot() 返回你可以用来操作图形的 ax 对象。在此特定情况下,你可以使用
set_ylim_example.py
ax.set_ylim([0.0, 1.0])来停止 Y 轴自动范围并将其范围设置为固定的 [0.0, 1.0]。
完整示例:
kaplan_meier_full_example.py
from lifelines.datasets import load_leukemia
from lifelines import KaplanMeierFitter
df = load_leukemia()

kmf = KaplanMeierFitter()
kmf.fit(df['t'], df['Rx']) # t = 时间点, Rx: 0=删失, 1=事件
ax = kmf.plot()
# 将 Y 轴范围设置为 [0.0, 1.0]
ax.set_ylim([0.0, 1.0])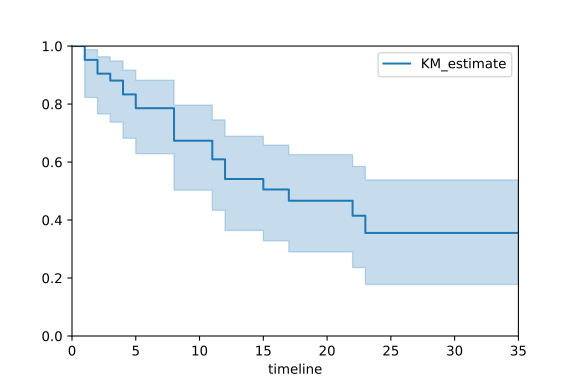
Check out similar posts by category:
Python, Statistics
If this post helped you, please consider buying me a coffee or donating via PayPal to support research & publishing of new posts on TechOverflow