
最小 Python Kaplan-Meier 图示例
安装 lifelines 库:
install_lifelines.sh
pip install -U lifelines现在你可以使用此代码片段从库中包含的示例数据集创建基本 Kaplan-Meier 图:
kaplan_meier_example.py
from lifelines.datasets import load_leukemia
from lifelines import KaplanMeierFitter
# 加载示例数据集
df = load_leukemia()

# 从数据创建模型
kmf = KaplanMeierFitter()
kmf.fit(df['t'], df['Rx']) # t = 时间点, Rx: 0=删失, 1=事件
# 绘制模型的生存曲线
kmf.plot()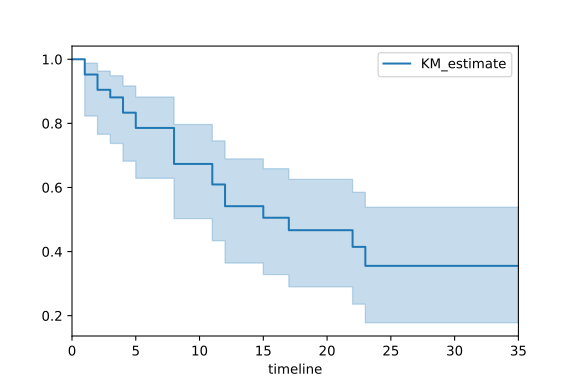
注意不同数据集可能有不同的时间列名称(在此示例中为 t)和事件/删失列名称(在此示例中为 Rx)
我们使用以下命令导出图形
save_km_plot.py
import matplotlib.pyplot as plt
plt.savefig("Kaplan-Meier-Example-Leukemias.svg")Check out similar posts by category:
Python, Statistics
If this post helped you, please consider buying me a coffee or donating via PayPal to support research & publishing of new posts on TechOverflow