
Matplotlib 自定义 SI 前缀单位刻度格式化器
你可以使用 UliEngineering 的 format_value() 轻松制作自定义 matplotlib 刻度格式化器,用 SI 前缀(如 k、M、G、T…)格式化值
格式化 Y 轴刻度
以下示例以单位 J(焦耳)格式化 Y 轴。例如,100000 将格式化为 100 kJ。
我们使用的格式化函数是
format_joules_fn.py
def format_joules(value, pos=None):
return format_value(value, 'J')为了设置格式化器函数,使用
set_y_formatter.py
# 将我们的格式化器设置为 Y 轴格式化器
plt.gca().yaxis.set_major_formatter(mtick.FuncFormatter(format_joules))示例:
si_formatter_example.py
import matplotlib.ticker as mtick
from UliEngineering.EngineerIO import format_value
from matplotlib import pyplot as plt

def format_joules(value, pos=None):
    return format_value(value, 'J')

# 将我们的格式化器设置为 Y 轴格式化器
plt.gca().yaxis.set_major_formatter(mtick.FuncFormatter(format_joules))格式化 X 轴刻度
为了改为格式化 X 轴刻度,使用相同的格式化函数但使用以下命令激活
set_x_formatter.py
# 将我们的格式化器设置为 Y 轴格式化器
plt.gca().xaxis.set_major_formatter(mtick.FuncFormatter(format_joules))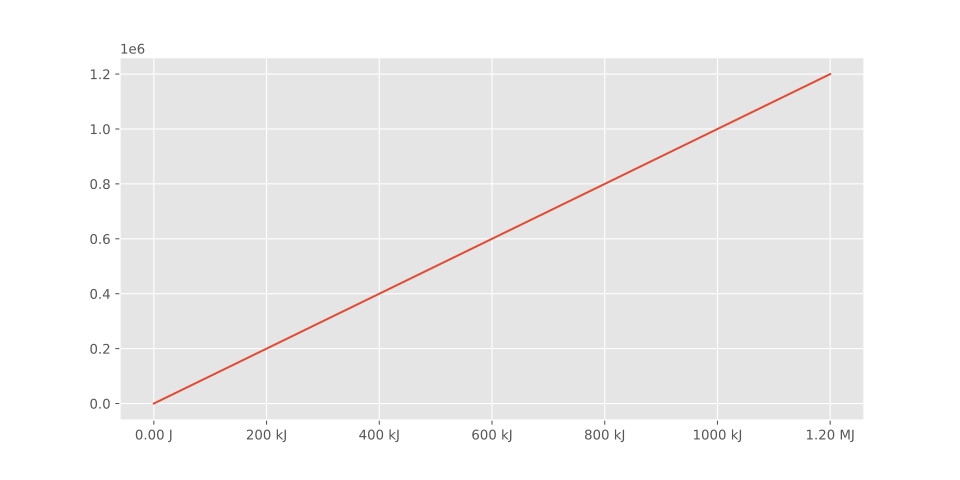
如何设置小数位数
UliEngineering 的 format_value() 允许你使用例如 significant_digits=4 设置小数位数
format_joules_sigdigits.py
def format_joules(value, pos=None):
return format_value(value, 'J', significant_digits=4)完整示例
此示例生成上面显示的 Y 轴图
mpl_si_formatter_full_example.py
import matplotlib.ticker as mtick
from UliEngineering.EngineerIO import format_value
from matplotlib import pyplot as plt
plt.style.use("ggplot")
import numpy as np

def format_joules(value, pos=None):
    return format_value(value, 'J')

# 将我们的格式化器设置为 Y 轴格式化器
plt.gca().yaxis.set_major_formatter(mtick.FuncFormatter(format_joules))

# 生成测试数据
test_data = np.arange(1, 1.2e6)
plt.plot(test_data)
plt.gcf().set_size_inches(10,5)
plt.savefig("/ram/mpl-si-formatter.svg")Check out similar posts by category:
Python
If this post helped you, please consider buying me a coffee or donating via PayPal to support research & publishing of new posts on TechOverflow