
使用 Cartopy 的最小测地线示例
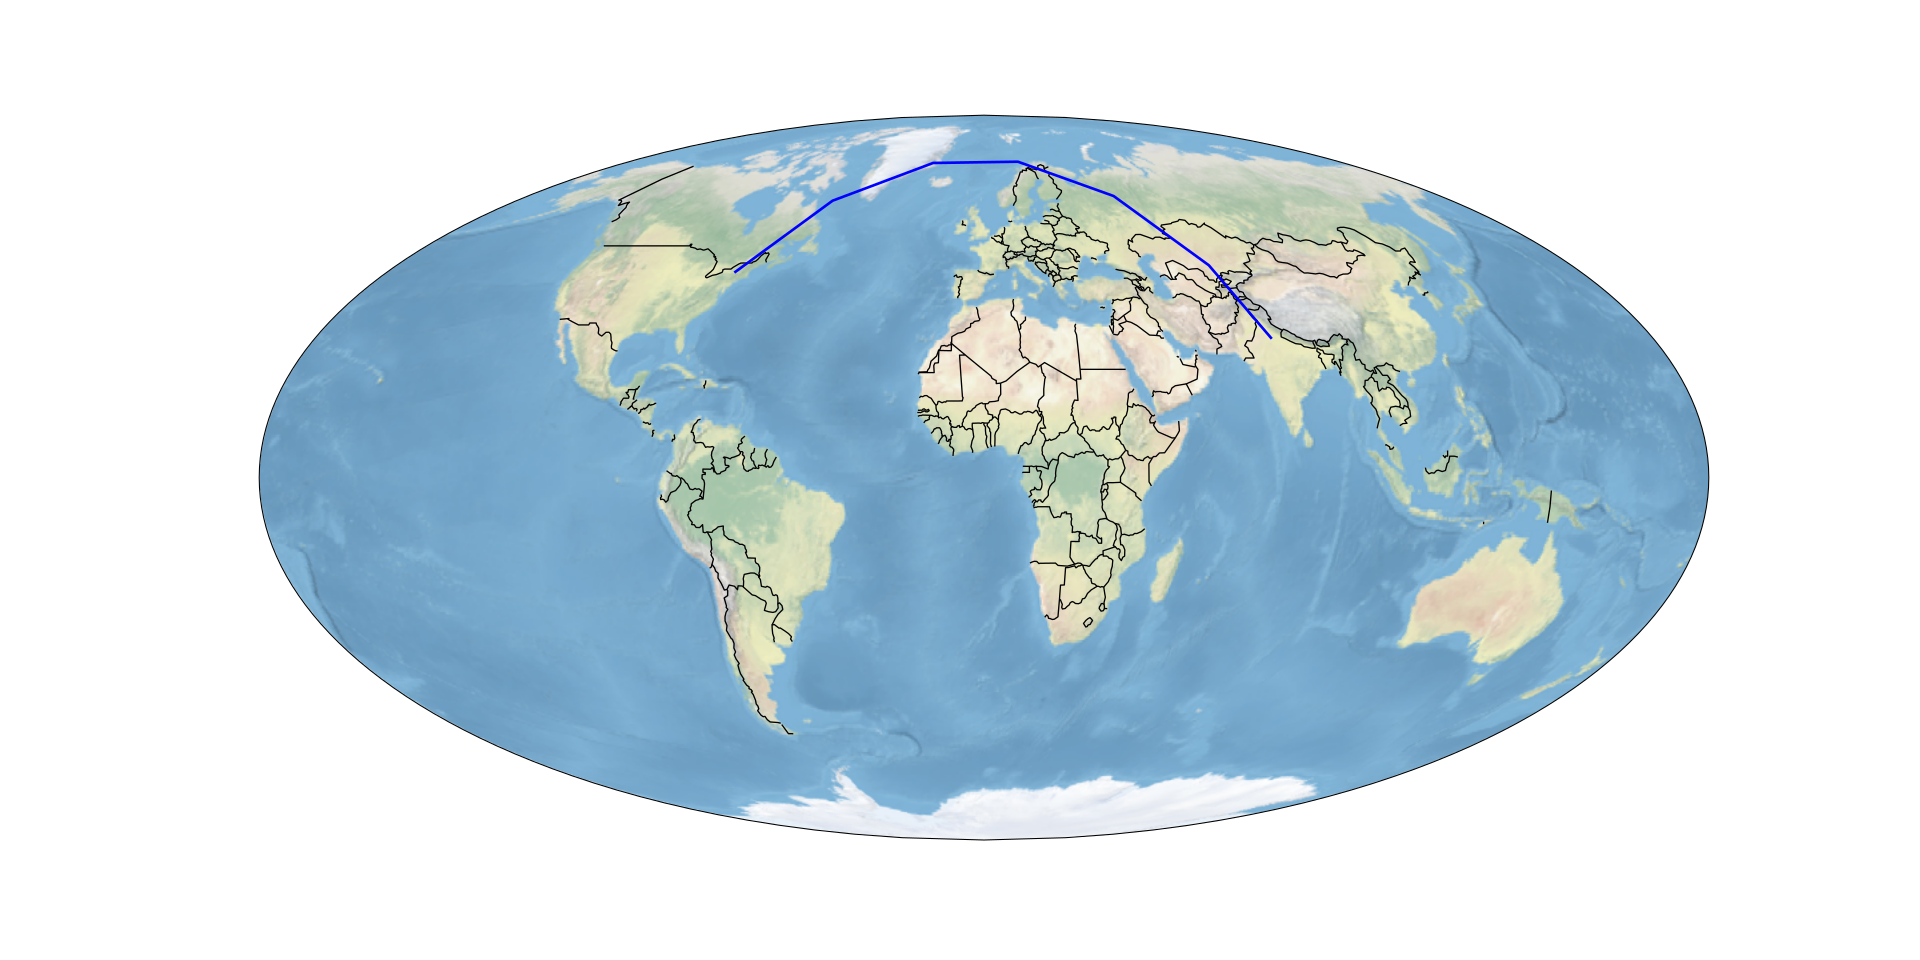
此最小示例展示如何在两点之间绘制测地线。它紧密基于 cartopy 与 matplotlib 介绍。
minimal-geodetic-example-using-cartopy.py
import cartopy.crs as ccrs
import cartopy.feature as cf
from matplotlib import pyplot as plt
ax = plt.axes(projection = ccrs.Mollweide())
ax.stock_img()
ax.add_feature(cf.BORDERS)
# 在两点之间添加测地线
# 格式:plot([lon1, lon2], [lat1, lat2])
plt.plot([-75, 77.23], [43, 28.61],
         color='blue', linewidth=2,
         transform=ccrs.Geodetic()
         )
完整示例代码
此代码重现上面显示的图像:
minimal-geodetic-complete.py
import cartopy.crs as ccrs
import cartopy.feature as cf
ax = plt.axes(projection = ccrs.Mollweide())
ax.stock_img()
ax.add_feature(cf.BORDERS)
# 在两点之间添加测地线
# 格式:plot([lon1, lon2], [lat1, lat2])
plt.plot([-75, 77.23], [43, 28.61],
         color='blue', linewidth=2,
         transform=ccrs.Geodetic()
         )
# 使图更大
plt.gcf().set_size_inches(20, 10)

# 将图保存为 SVG
plt.savefig("Cartopy-Geodetic.svg")If this post helped you, please consider buying me a coffee or donating via PayPal to support research & publishing of new posts on TechOverflow