
matplotlib:如何轻松将 y 值格式化为百分比 [%]
绘制我们的时间序列示例数据集时,这是结果图
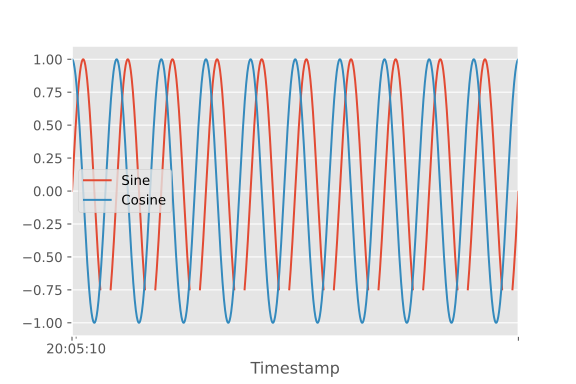
本文展示如何轻松绘制此数据集y 轴格式化为百分比。我们将假设 1.00 映射到 100%。本文基于我们之前的工作Matplotlib 自定义 SI 前缀单位刻度格式化器:
注意对于 pandas,你需要先调用 df.plot() 然后再调用 set_major_formatter()!
matplotlib_percent.py
import matplotlib.ticker as mtick
df.plot()
plt.gca().yaxis.set_major_formatter(mtick.PercentFormatter(xmax=1.0))如果你想改为 100.0 映射到 100%,只需使用 xmax=100.0:
matplotlib_percent_example.py
import matplotlib.ticker as mtick
df.plot()
plt.gca().yaxis.set_major_formatter(mtick.PercentFormatter(xmax=1.0))完整示例
matplotlib_full_example.py
import matplotlib.ticker as mtick

# 加载预构建的时间序列示例数据集
df = pd.read_csv("https://datasets.techoverflow.net/timeseries-example.csv", parse_dates=["Timestamp"])
df.set_index("Timestamp", inplace=True)

# 绘制 Y 轴缩放为百分比
df.plot()
plt.gca().yaxis.set_major_formatter(mtick.PercentFormatter(xmax=1.0))If this post helped you, please consider buying me a coffee or donating via PayPal to support research & publishing of new posts on TechOverflow