
如何使用 PySpice 对电阻分压器进行 DC 扫描
以下代码使用 PySpice 通过 DC 扫描模拟电阻 10kΩ / 1kΩ 分压器,可作为模拟简单电路的合适起点。我们从 0V 扫描到 5V,步长为 10mV。
另请参阅我们之前的文章如何使用 PySpice 模拟电阻分压器了解使用瞬态分析的替代版本:
pyspice_dc_sweep.py
import PySpice.Logging.Logging as Logging
logger = Logging.setup_logging()

from PySpice.Probe.Plot import plot
from PySpice.Spice.Netlist import Circuit
from PySpice.Unit import *

circuit = Circuit("MyCircuit")
# 创建电压源:5V DC
source = circuit.VoltageSource('in', 'in', circuit.gnd, dc_value=5@u_V)
# 创建电阻分压器
r1 = circuit.R('R1', 'in', 'n1', 10@u_kΩ)
r2 = circuit.R('R2', 'n1', circuit.gnd, 1@u_kΩ)
# 模拟从 0V 到 5.0V 的 DC 扫描,步长为 0.01V
simulator = circuit.simulator(temperature=25, nominal_temperature=25)
analysis = simulator.dc(Vin=slice(0, 5.0, 0.01))你可以使用 analysis['n1'] 访问分压器的输出电压数组(即节点 n1)。记住,如果 circuit.VoltageSource 的第一个参数是 'in',则 simulator.dc 的参数将被称为 Vin,而不仅仅是 in!V 会自动被前置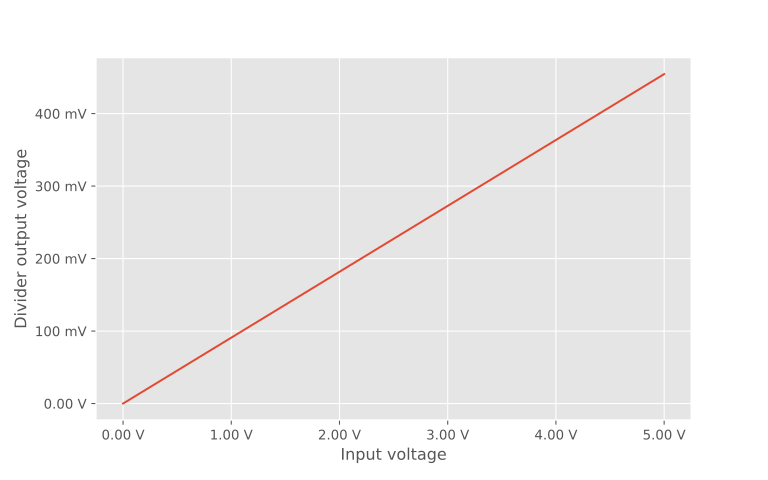
这是我们用来绘制的代码:
plot_dc_sweep.py
import matplotlib.ticker as mtick
import matplotlib.pyplot as plt
from UliEngineering.EngineerIO import format_value

def format_volts(value, pos=None):
    return format_value(value, 'V')

plt.style.use("ggplot")
plt.xlabel("输入电压")
plt.xlabel("分压器输出电压")
plt.gca().yaxis.set_major_formatter(mtick.FuncFormatter(format_volts))
plt.gca().xaxis.set_major_formatter(mtick.FuncFormatter(format_volts))
plt.gcf().set_size_inches(8,5)
plt.plot(analysis["in"], analysis["n1"], label="Input voltage")
plt.savefig("/ram/PySpice-Voltage-Divider-Sweep.svg")Check out similar posts by category:
Electronics, Python, SPICE
If this post helped you, please consider buying me a coffee or donating via PayPal to support research & publishing of new posts on TechOverflow