
如何在 Python 中使用 skyfield 计算和绘制太阳路径图
在此示例中,我们将展示如何为预定位置的任意给定日期生成太阳路径图。通过使用 skyfield 库,我们可以获得太阳在天空中位置的极其准确的预测,与许多其他库相比,我们可以使用相同的方法预测其他天体的位置。
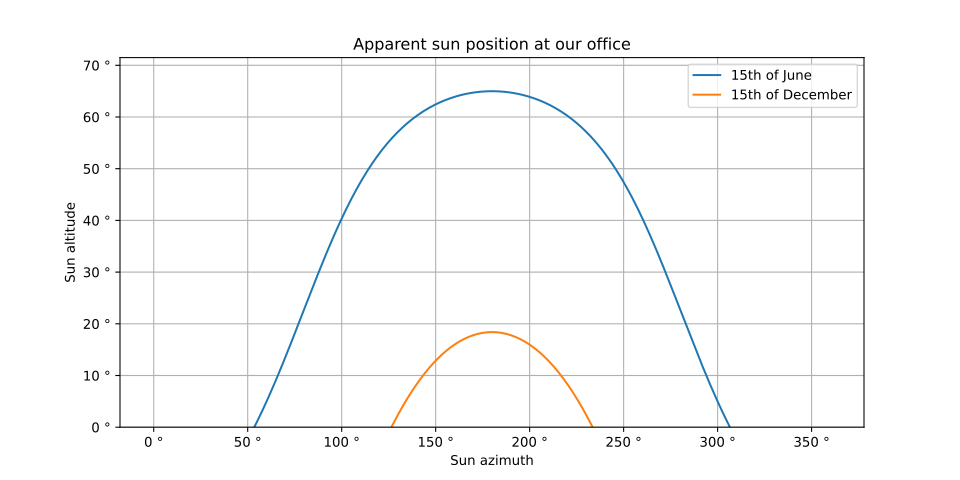
sun_path_plot.py
#!/usr/bin/env python3
from skyfield import api
from skyfield import almanac
from datetime import datetime
from datetime import timedelta
from matplotlib import pyplot as plt
import pytz
import dateutil.parser
from collections import namedtuple
from UliEngineering.Utils.Date import *
import matplotlib.ticker as mtick

# Matplotlib 格式化器
def format_degrees(value, pos=None):
    return f'{value:.0f} °'

ts = api.load.timescale()
ephem = api.load_file('de421.bsp')

sun = ephem["Sun"]
earth = ephem["Earth"]

# 数据类型
AltAz = namedtuple("AltAz", ["altitude", "azimuth", "distance"])
TimeAltAz = namedtuple("TimeAltAz", ["time", "altitude", "azimuth", "distance"])

def sun_altaz(planet_at_location, ts):
    # 计算从 <location> 处的观察者看到的太阳位置
    sun_pos = planet_at_location.at(ts).observe(sun).apparent()
    # 计算太阳位置的视高度和方位角
    altitude, azimuth, distance = sun_pos.altaz()
    return AltAz(altitude, azimuth, distance)

def sun_altaz_for_day(location, year, month, day, tz):
    earth_at_location = (earth + location)

    minutes = list(yield_minutes_on_day(year=year, month=month, day=day, tz=tz))
    skyfield_minutes = ts.from_datetimes(minutes)

    minutely_altaz = [sun_altaz(earth_at_location, ts) for ts in skyfield_minutes]
    # Extract components for plotting
    minutely_alt = [altaz.altitude.degrees for altaz in minutely_altaz]
    minutely_az = [altaz.azimuth.degrees for altaz in minutely_altaz]
    minutely_distance = [altaz.distance for altaz in minutely_altaz]

    return TimeAltAz(minutes, minutely_alt, minutely_az, minutely_distance)

# 慕尼黑附近的随机位置
location = api.Topos('48.324777 N', '11.405610 E', elevation_m=519)
# 计算两个不同日期的高度/方位角
jun = sun_altaz_for_day(location, 2022, 6, 15, pytz.timezone("Europe/Berlin"))
dec = sun_altaz_for_day(location, 2022, 12, 15, pytz.timezone("Europe/Berlin"))

# 绘图!
plt.gca().yaxis.set_major_formatter(mtick.FuncFormatter(format_degrees))
plt.gca().xaxis.set_major_formatter(mtick.FuncFormatter(format_degrees))

plt.plot(jun.azimuth, jun.altitude, label="15th of June")
plt.plot(dec.azimuth, dec.altitude, label="15th of December")
plt.ylim([0, None]) # 不显示地平线以下的太阳角度
plt.ylabel("Sun altitude")
plt.xlabel("Sun azimuth")
plt.title("我们办公室的视太阳位置")
plt.grid()
plt.gca().legend()
plt.gcf().set_size_inches(10,5)

plt.savefig("Sun path.svg")If this post helped you, please consider buying me a coffee or donating via PayPal to support research & publishing of new posts on TechOverflow