
使用 Rust plotters crate 实现 matplotlib ggplot 风格的效果
以下 Rust 代码是我使用 Rust plotters crate 最接近 matplotlib ggplot 示例的实现。
Rust 代码
src/main.rs
use plotters::prelude::*;
use plotters::style::{RGBColor, ShapeStyle};
use std::error::Error;

const GGPLOT_RED: RGBColor = RGBColor(0xE2, 0x4A, 0x33);

fn main() -> Result<(), Box<dyn Error>> {
    // 创建绘图区域并设置图表
    let root = BitMapBackend::new("sine_wave_plot.png", (1024, 768)).into_drawing_area();
    // 整体图形背景(保持白色)
    root.fill(&WHITE)?;

    // 定义图表区域(我们将绘图面板设为浅灰色作为网格背景)
    let mut chart = ChartBuilder::on(&root)
        .caption("Sine Wave", ("sans-serif", 30).into_font())
        .margin(24)
        .x_label_area_size(50)
        .y_label_area_size(50)
        .build_cartesian_2d(0f64..2f64 * std::f64::consts::PI, -1.2f64..1.2f64)?;

    // 用浅灰色填充绘图区域作为网格背景
    // matplotlib ggplot: axes.facecolor = E5E5E5
    chart.plotting_area().fill(&RGBColor(0xE5, 0xE5, 0xE5))?;

    // 配置网格(ggplot 风格,带有细微网格线)
    chart.configure_mesh()
        .x_labels(10)
        .y_labels(5)
        .x_label_formatter(&|x| format!("{:.1}π", x / std::f64::consts::PI))
        .y_label_formatter(&|y| format!("{:.1}", y))
        .x_desc("Angle (radians)")
        .y_desc("Amplitude")
        // matplotlib ggplot: axes.labelcolor/xtick.color/ytick.color = 555555
        .label_style(TextStyle::from(("sans-serif", 12).into_font()).color(&RGBColor(0x55, 0x55, 0x55)))
        .axis_desc_style(TextStyle::from(("sans-serif", 16).into_font()).color(&RGBColor(0x55, 0x55, 0x55)))
        // matplotlib ggplot: grid.color = white(主网格);次网格默认关闭
        .max_light_lines(0)
        .bold_line_style(ShapeStyle::from(&WHITE).stroke_width(1))
        .light_line_style(ShapeStyle::from(&WHITE).stroke_width(1))
        // matplotlib ggplot: axes.edgecolor = white, axes.linewidth = 1
        .axis_style(ShapeStyle::from(&WHITE).stroke_width(1))
        // 确保刻度向外(负值会向内)
        .set_all_tick_mark_size(5)
        .draw()?;

    // 生成正弦波数据点
    let mut sine_data = Vec::new();
    for i in 0..=1000 {
        let x = i as f64 * 2.0 * std::f64::consts::PI / 1000.0;
        sine_data.push((x, x.sin()));
    }

    // 绘制正弦波
    chart.draw_series(LineSeries::new(
        sine_data,
        ShapeStyle::from(&GGPLOT_RED).stroke_width(2),
    ))?
    .label("sin(x)")
    .legend(|(x, y)| PathElement::new(vec![(x, y), (x + 20, y)], ShapeStyle::from(&GGPLOT_RED).stroke_width(3)));

    // 绘制图例
    chart.configure_series_labels()
        .background_style(&RGBColor(0xE5, 0xE5, 0xE5).mix(0.9))
        .border_style(&WHITE)
        .label_font(("sans-serif", 14))
        .position(SeriesLabelPosition::UpperRight)
        .draw()?;

    Ok(())
}Cargo.toml
[package]
name = "plottest"
version = "0.1.0"
edition = "2021"

[dependencies]
plotters = "0.3.5"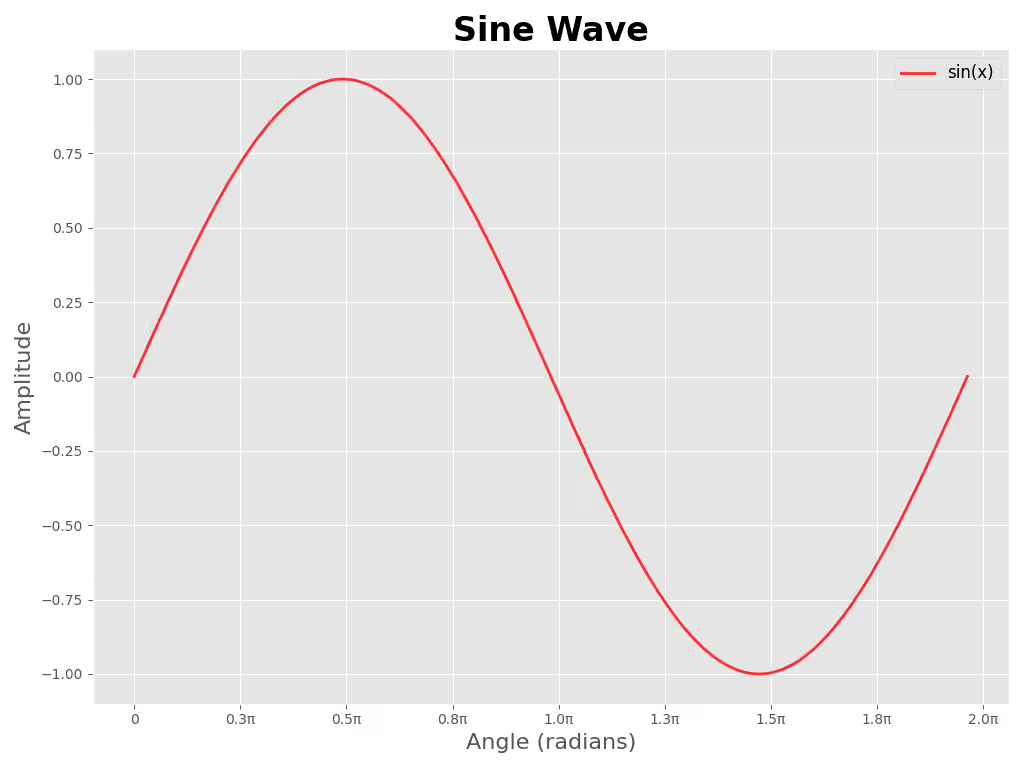
参考的 Python 代码
sine_wave_plot.py
#!/usr/bin/env python3
"""以 ggplot 风格生成正弦波图并保存到 `sine_wave_plot_py.png`。

用法:
    python3 plot_sine.py

安装依赖:
    python3 -m pip install -r requirements.txt
"""

import numpy as np
import matplotlib.pyplot as plt
from matplotlib.ticker import FuncFormatter

plt.style.use("ggplot")

# 数据
x = np.linspace(0, 2 * np.pi, 1000)
y = np.sin(x)

# 图形尺寸近似为 100 DPI 下的 1024x768
fig, ax = plt.subplots(figsize=(10.24, 7.68))
ax.plot(x, y, color="red", alpha=0.8, linewidth=2, label="sin(x)")

# 以 π 的倍数格式化 x 轴刻度
def pi_label(value, _pos):
    val = value / np.pi
    if abs(val) < 1e-6:
        return "0"
    return f"{val:.1f}π"

ax.xaxis.set_major_locator(plt.MaxNLocator(10))
ax.xaxis.set_major_formatter(FuncFormatter(pi_label))

# 标签、标题、图例
ax.set_xlabel("Angle (radians)", fontsize=16)
ax.set_ylabel("Amplitude", fontsize=16)
ax.set_title("Sine Wave", fontsize=24, fontweight="bold")
ax.legend(fontsize=12)

# 网格和布局
ax.grid(True)
plt.tight_layout()

# 保存文件
plt.savefig("sine_wave_plot_py.png", dpi=100)
# 取消注释以交互式显示
# plt.show()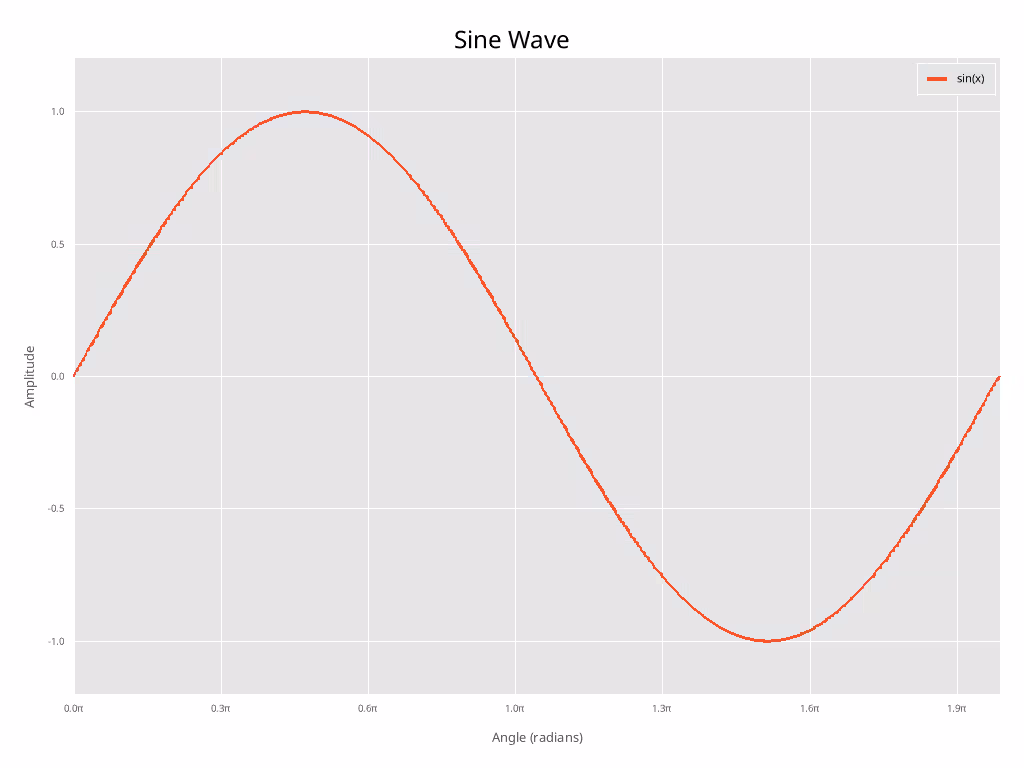
差异讨论
注: 我并未尝试以任何方式匹配字体大小等。
如你所见,经过一些手动调整,两幅图看起来相当相似。然而,由于 plotters crate 尚未实现抗锯齿(截至 2026-01-30),Rust 图比 matplotlib 图明显更"锯齿"。
就出版级质量的图表而言,这是一个重大缺陷,因此我无法推荐使用。希望未来能实现抗锯齿。
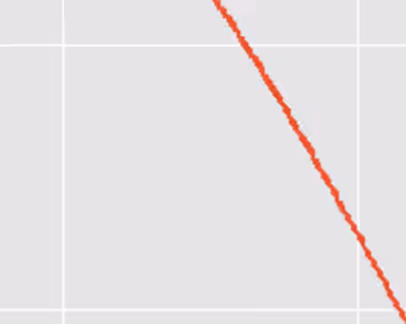
Python 抗锯齿特写
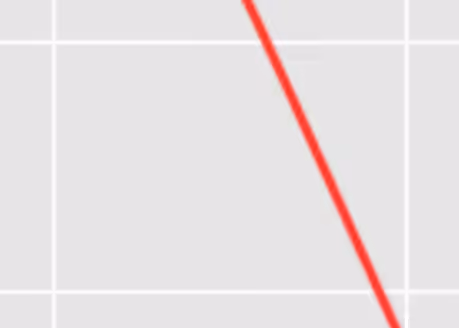
Rust “抗锯齿”(无)特写
Check out similar posts by category:
Rust, Python, Data Visualization
If this post helped you, please consider buying me a coffee or donating via PayPal to support research & publishing of new posts on TechOverflow